LogTag Analyzer software is the free companion software recommended if you own a LogTag product. It provides an easy-to-use, powerful platform for configuring, downloading, and displaying data from any LogTag data logger.
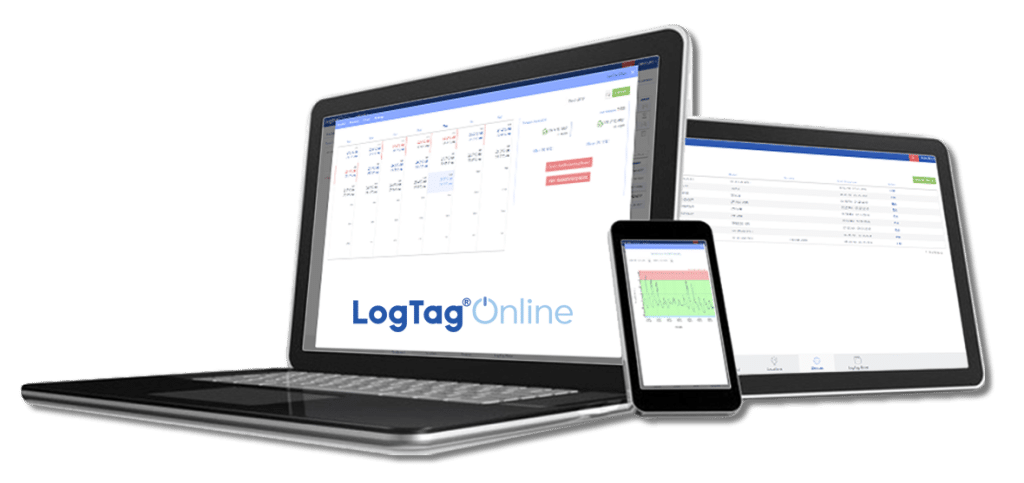
LogTag Online is a cloud-based online environmental management system that allows its users to download data from LogTag dataloggers, view data in the cloud, and allows sharing and securing of the data using a permissions system.
LogTag Xpress is a sophisticated lightweight alternative to the powerful LogTag Analyzer software, that deliberately comes without a rich feature set and instead focuses on as little interaction required as possible.
LogTag Convert copies LogTag Analyzer files (*.ltd files) to text files such as CSV files. Organizations can use this program to quickly and efficiently bulk convert data so they can be transferred to other programs, without the need to open files individually.